
A tissue is not a uniform mass: it is thousands of different cells, each with its own identity and state. With 10x Genomics Chromium technology we read the transcriptome of each cell separately, and with deep learning we turn that map into answers: which cells are there, how they change and which ones matter for your question.
When you measure a whole tissue you get the average of all its cells. If only a small population changes, that signal is diluted and disappears. Single-cell brings it back.
Fast and very useful for comparing conditions, but all cells are blended into a single value. Small populations and intermediate states stay hidden.
Each cell is read separately and grouped with similar ones. Cell types, activation states and that rare population that explains your phenotype come to light.
The challenge of single-cell is reading thousands of cells at once without losing track of which cell each message came from. The 10x Genomics Chromium platform, the reference in the field, solves it with microdroplets.
Cells in suspension flow through a microfluidic chip that encloses them, one by one, in tiny droplets together with a gel bead. Each bead carries millions of copies of a unique cell barcode. Inside the droplet the cell is lysed and all its RNA is tagged with that barcode. Each molecule also receives a UMI, its own identifier, so we count real molecules and not copies. Everything is then sequenced together and the barcodes let us rebuild, cell by cell, which genes were active.
The chip encapsulates thousands of cells in minutes, enough to capture even populations that make up a tiny fraction of the tissue.
All the RNA from one cell shares the same barcode, so nothing gets mixed: every profile belongs to a specific cell.
The UMI tells each original molecule apart from its amplification copies, so the expression we measure is the real one.
10x Genomics offers several chemistries on the same platform. We choose with you the one that best fits your sample and what you want to discover.
The standard for characterizing cell types and states and comparing conditions at single-cell resolution.
Gene expression and, in the same cell, the sequence of T and B cell receptors (TCR/BCR) to study clonality and immune response.
Works with fixed cells and even paraffin-embedded samples. Lets you collect samples at different times and process them together, and scale up to very large studies.
Chromatin accessibility and gene expression from the same cell: not only which genes switch on, but which regulatory regions allow it.
Adds surface markers with tagged antibodies to read RNA and protein at the same time and sharpen the identity of each cell.
When live cells cannot be obtained, for example in frozen tissue, brain or biobanks, we read the cell nuclei.
In single-cell, sample quality decides almost everything. We support you from collection so it arrives in the best possible condition.
Good viability keeps RNA from damaged cells from contaminating the data.
Separating cells without stressing them or losing the most fragile types, with a protocol adapted to each tissue.
Depending on the tissue and logistics, we choose between fresh cells, nuclei or fixation, which lets you store samples and process them later.
We plan how and when each sample is processed so the differences are biological and not technical.
A single-cell experiment generates millions of data points, very sparse and full of technical noise. Classic linear methods fall short, so we use deep learning models that learn the real statistical structure of your cells.
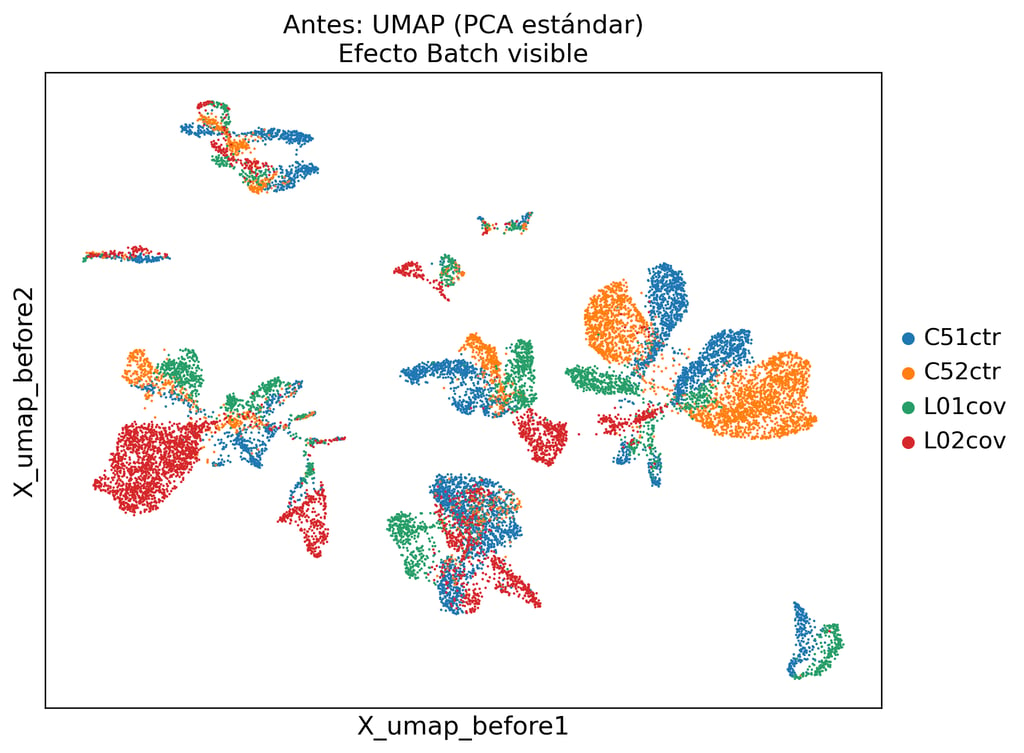
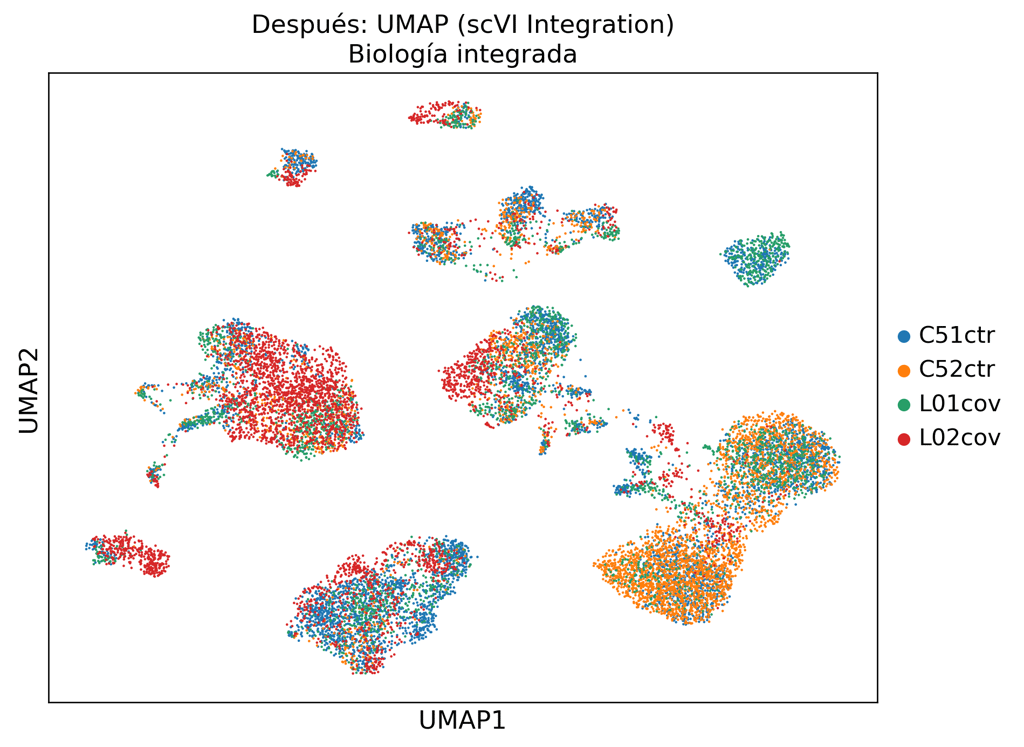
All your cells grouped and identified by type and state, with their markers.
Proportions and genes that change between conditions, population by population.
How cells transition between states and which signals they exchange.
Cell maps, dot plots and heatmaps ready to publish, with a report explaining what they mean.
Explore your atlas whenever you want, no coding needed: color the map by any gene, compare populations and build your own interactive plots from your private area.
Tell us your question and your sample type. We will propose the chemistry, the design and how to prepare your samples to get the most out of every cell.